Monitor Dashboard Metrics
This document serves as a supplementary introduction to explain the metrics of each monitoring dashboard in the traffic monitoring section of the mesh instance. It aims to facilitate user queries and definitions.
Global Monitor
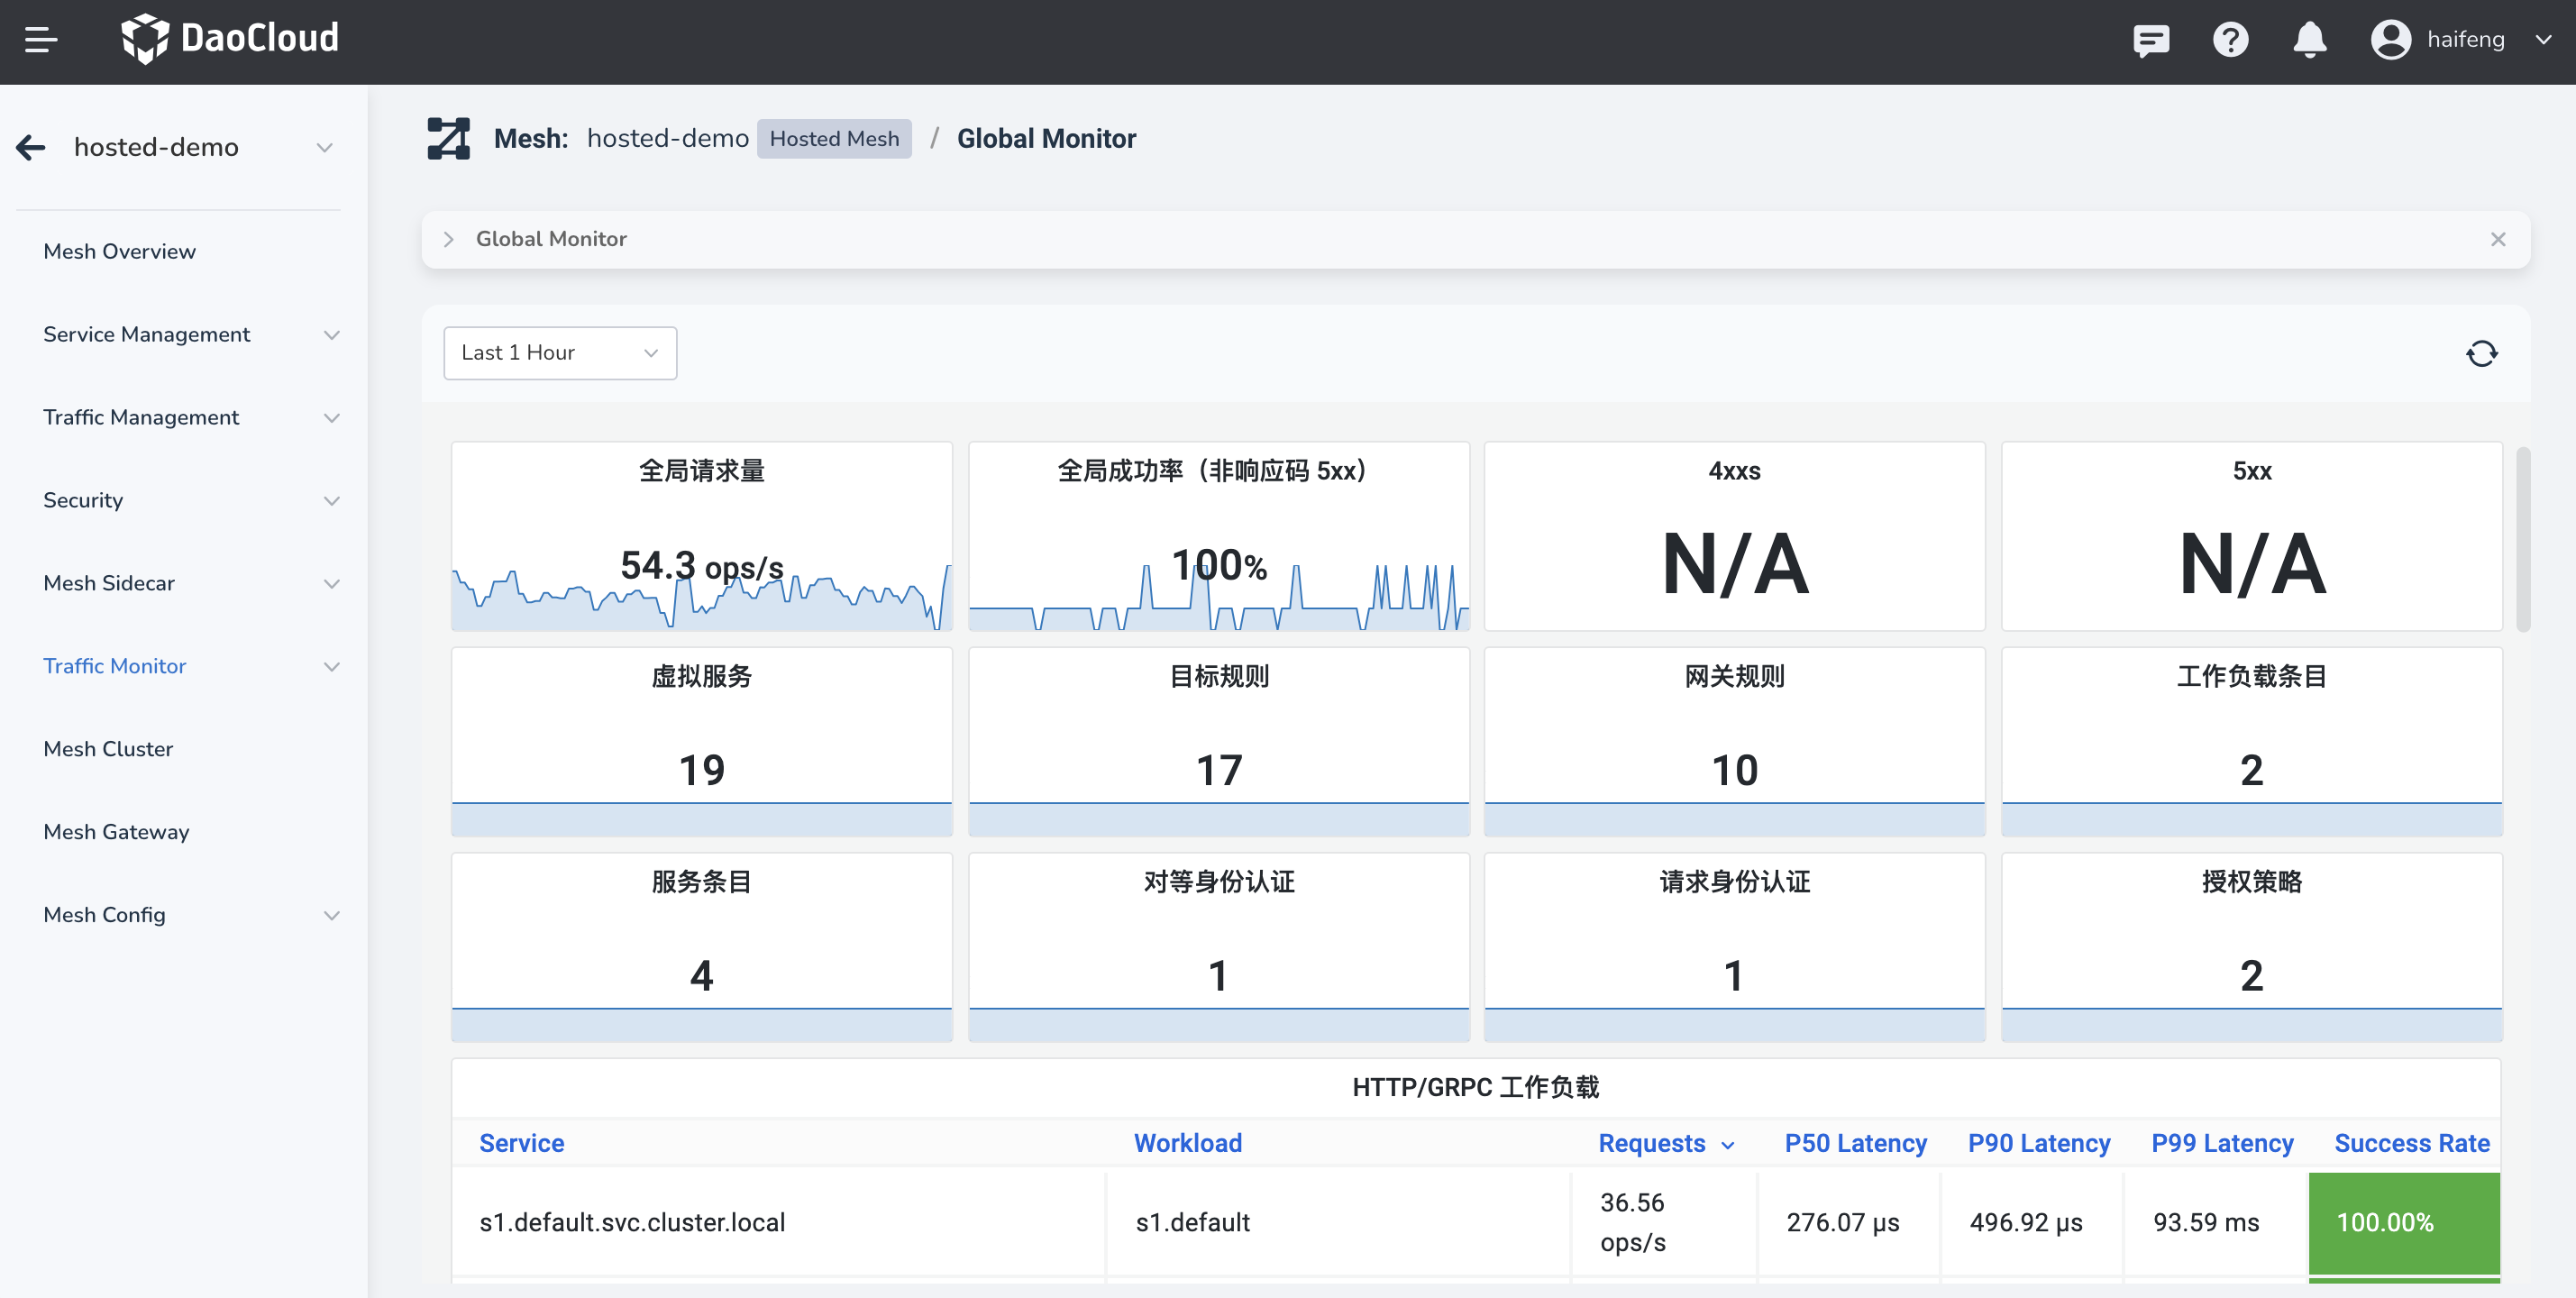
| Category | Parameters | Description | How to calculate |
|---|---|---|---|
| General | Global Request Volume | "Global Request Volume" represents the total request volume in the entire service mesh. Ops/s denotes the number of operations or requests executed per second. In Istio, this metric is typically used to assess the overall traffic in the service mesh. | OPS/s = Total Operations / Time Period (seconds) |
| Global Success Rate (non-5xx responses) | Global Success Rate (Non-5xx Responses) = (Total Requests - 5xx Responses) / Total Requests * 100 | ||
| 4xxs | 4xxs represent client errors, indicating potential issues with the request (e.g., 404 indicates not found). | ops/s = Number of 4xx responses received per second | |
| 5xxs | 5xxs represent server errors, indicating that the server failed to handle valid requests correctly (e.g., 500 indicates internal server error). | ops/s = Number of 5xx responses received per second | |
| Virtual Services | Measures the net growth of virtual services within the service mesh over a specific time range. By comparing the number of addition and deletion events, it is possible to understand the dynamic changes in services, which helps identify potential issues. | max(Virtual Services && and) - max(Virtual Services && delete) | |
| Destination Rules | Measures the net growth of destination rules within the service mesh over a specific time range. By comparing the number of addition and deletion events, it is possible to understand the dynamic changes in services, which helps identify potential issues. | max(Destination Rule && and) - max(Destination Rule && delete) | |
| Gateways | Measures the net growth of gateways within the service mesh over a specific time range. By comparing the number of addition and deletion events, it is possible to understand the dynamic changes in services, which helps identify potential issues. | max(Gateway && and) - max(Gateway && delete) | |
| Workload Entries | Measures the growth trend of WorkloadEntry over a specific time range. By observing changes in workload, it is possible to quickly understand the dynamic changes in services, which helps identify potential issues. | max(WorkloadEntry && and) - max(WorkloadEntry && delete) | |
| Service Entries | Measures the growth trend of Service Entries over a specific time range. By observing changes in Service Entries, it is possible to quickly understand the dynamic changes in services, which helps identify potential issues. | max(Service Entries && and) - max(Service Entries && delete) | |
| PeerAuthentication Policies | Measures the growth trend of PeerAuthentication Policies over a specific time range. By observing changes in PeerAuthentication Policies, it is possible to quickly understand the dynamic changes in services, which helps identify potential issues. | max(PeerAuthentication Policies && and) - max(PeerAuthentication Policies && delete) | |
| RequestAuthentication Policies | Measures the growth trend of RequestAuthentication Policies over a specific time range. By observing changes in RequestAuthentication Policies, it is possible to quickly understand the dynamic changes in services, which helps identify potential issues. | max(RequestAuthentication Policies && and) - max(RequestAuthentication Policies && delete) | |
| Authorization Policies | Measures the growth trend of Authorization Policies over a specific time range. By observing changes in Authorization Policies, it is possible to quickly understand the dynamic changes in services, which helps identify potential issues. | max(Authorization Policies && and) - max(Authorization Policies && delete) | |
| HTTP/GRPC Workloads | Service | The name of the service, which combines the namespace where the service resides with the Kubernetes Service access information. | |
| Workload | The name of the workload, which combines the namespace where the workload resides. | ||
| Requests | The number of requests, representing the total number of requests within a specific time period. | sum(rate(istio_requests_total{...}[1m])) | |
| P50 Latency | The median latency, where 50% of requests are completed below this time. | histogram_quantile(0.50, sum(rate(...))) | |
| P90 Latency | 90% of requests are completed below this time. | histogram_quantile(0.90, sum(rate(...))) | |
| P99 Latency | 99% of requests are completed below this time. | histogram_quantile(0.99, sum(rate(...))) | |
| Success Rate | The success rate, indicating the percentage of successful responses (response status code not equal to 5xx) within the query time range. | sum(rate(... response_code!~"5.*")) / sum(rate(...)) | |
| TCP Workloads | Service | The name of the service, obtained from the destination_service label in the provided Istio metrics, which includes the service's name. | destination_workload |
| Workload | The name of the workload, obtained from the destination_workload label in the provided Istio metrics, which includes the workload's name. | destination_service | |
| Bytes Sent | The number of bytes sent per second. | Calculated by accumulating TCP bytes using istio_tcp_sent_bytes_total and using rate to calculate the corresponding sending rate. | |
| Bytes Received | The number of bytes received per second. | Calculated by accumulating TCP bytes using istio_tcp_received_bytes_total and using rate to calculate the corresponding receiving rate. | |
| Istio Component-Based Version | Visualization of Istio component build versions, showing the distribution of versions for each component and their deployment in different clusters. This is useful for understanding the health and consistency of Istio deployments. | sum(istio_build{mesh_id="$mesh"}) by (component, tag, mesh_cluster) |
Performance Monitor
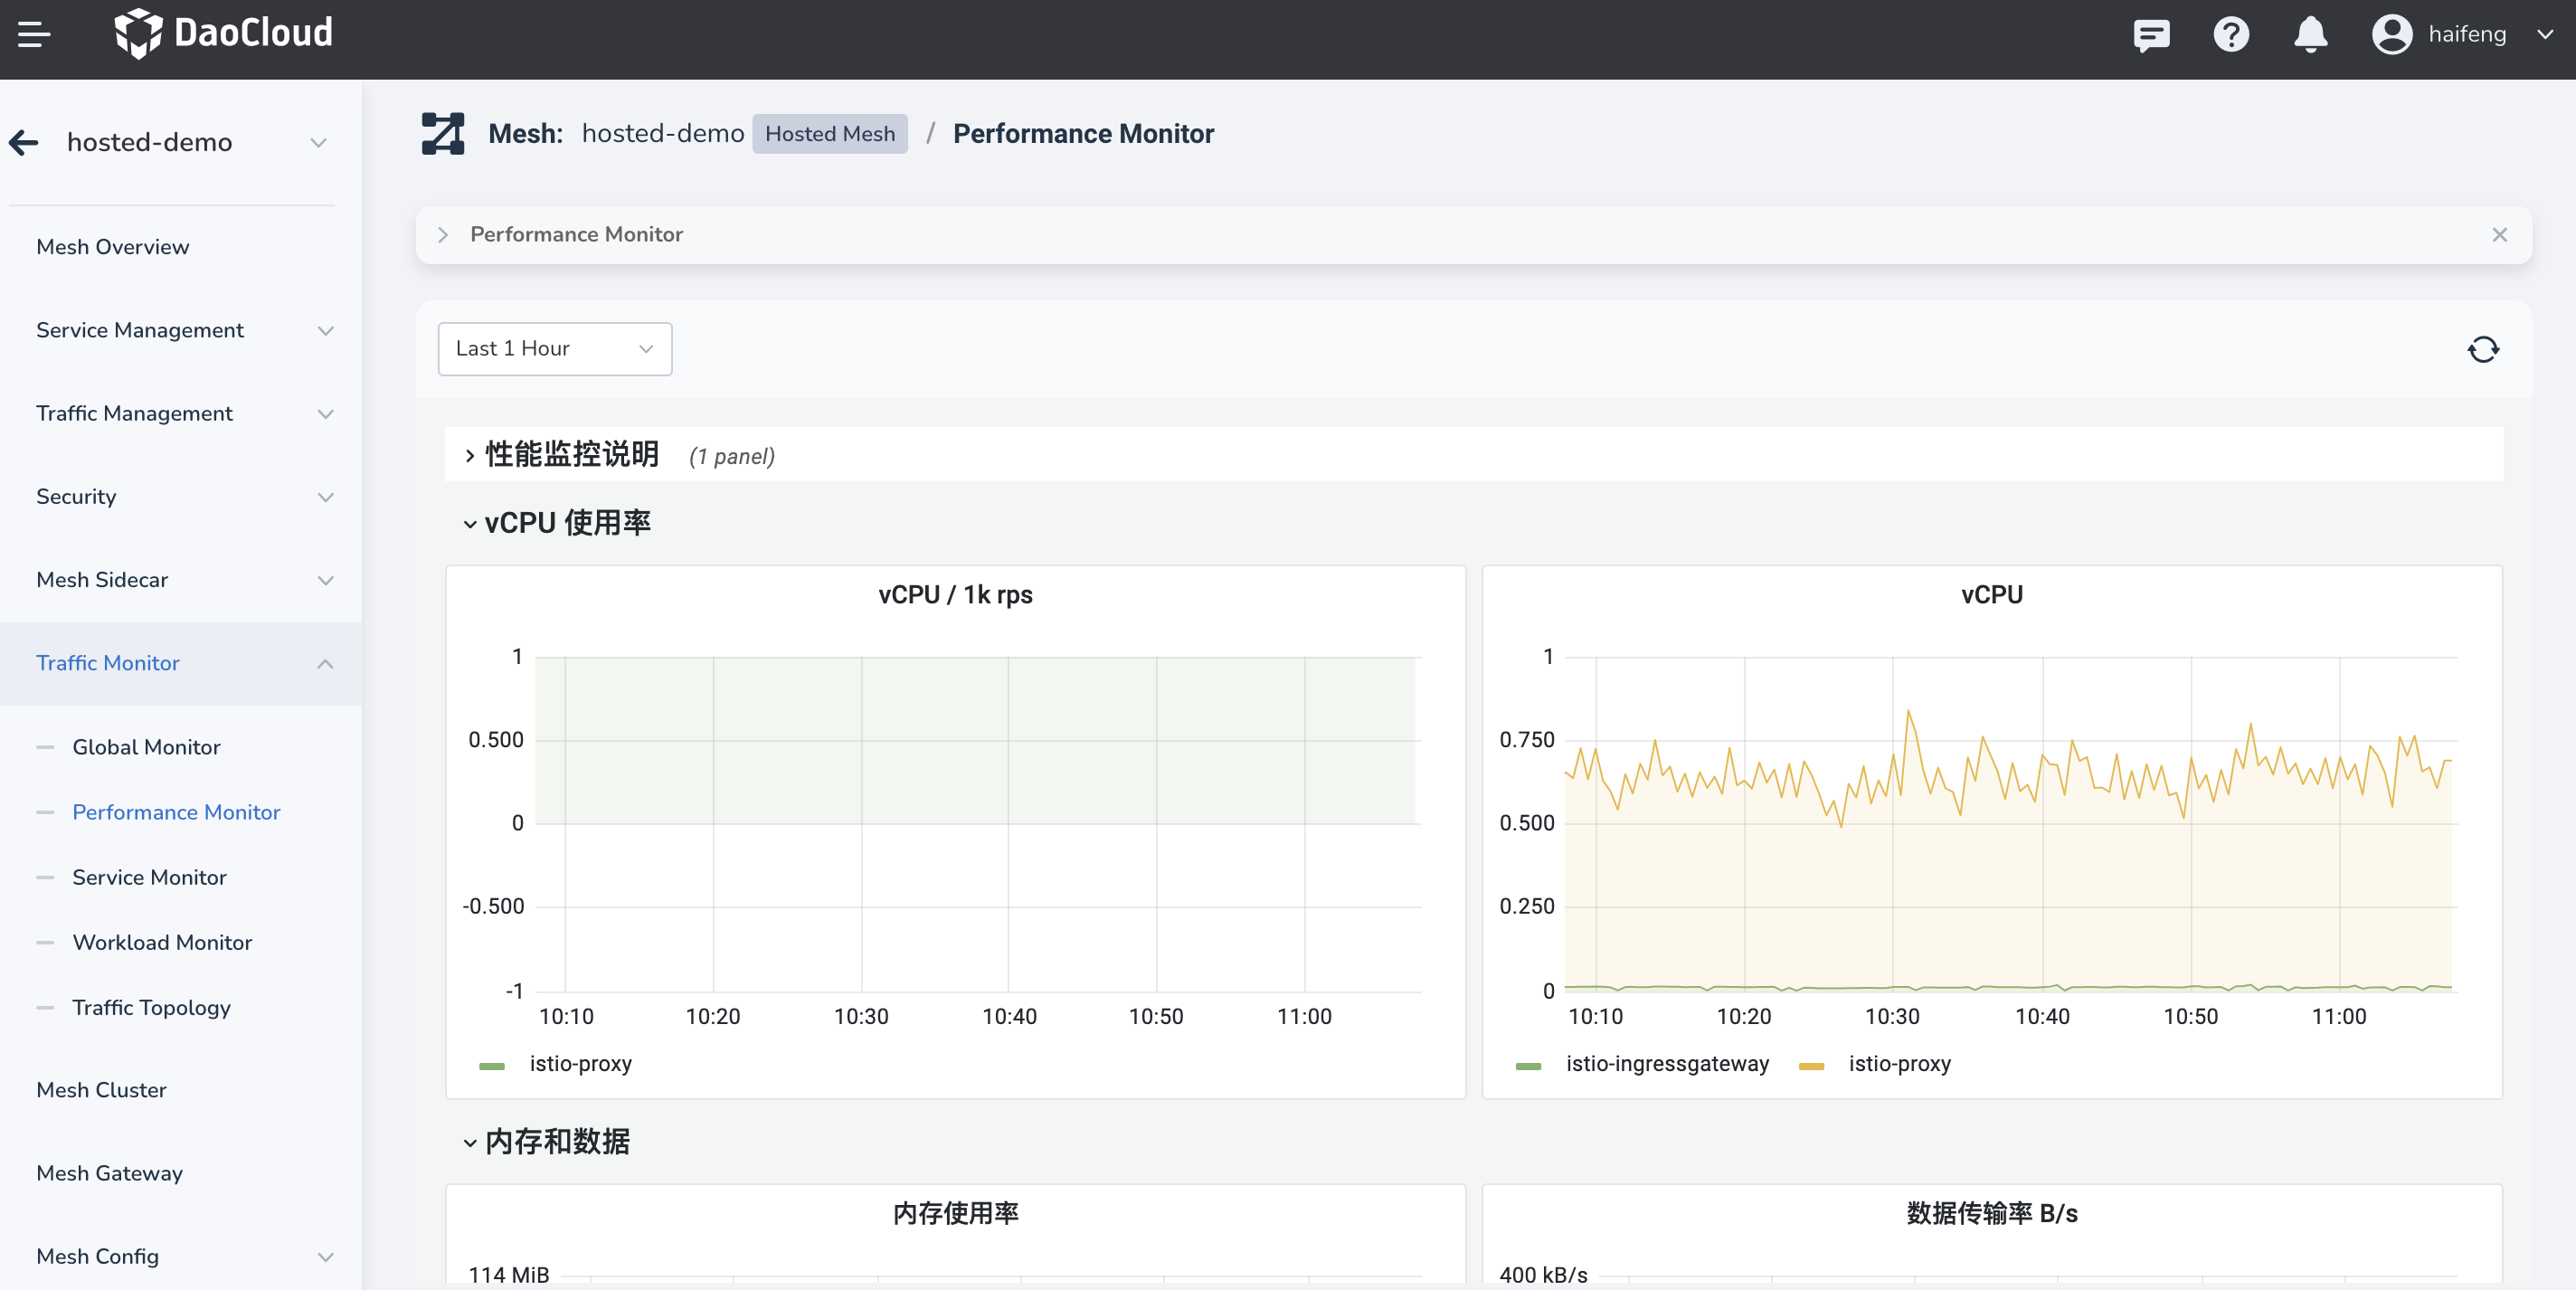
| Category | Parameters | Description | How to calculate | | ------------------- | ------------- | ------------------ | | VCPU Usage | vCPU / 1k rps | Displays the virtual CPU (vCPU) resources consumed per thousand requests (1k rps) in Istio, primarily querying istio-ingressgateway and istio-proxy. To ensure query efficiency, Istio only performs istio-proxy statistics when the number of istio-ingressgateway requests is greater than 10. | (sum(irate(container_cpu_usage_seconds_total{namespace!="istio-system",container="istio-proxy"}[1m]))/ (round(sum(irate(istio_requests_total[1m])), 0.001)/1000))/ (sum(irate(istio_requests_total{source_workload="istio-ingressgateway"}[1m])) >bool 10) | | | vCPU | Displays the overall usage of virtual CPUs (vCPUs) in Istio. | | | Memory and Data | Memory Usage | Displays the memory usage of Istio system components, measured in bytes. | sum(container_memory_working_set_bytes{pod=~"istio-ingressgateway-."}) / count(container_memory_working_set_bytes{pod=~"istio-ingressgateway-.",container!="POD"}) | | | Bytes transferred / sec | Displays the number of bytes transmitted per second by Istio system components, measured in Bps. | sum(irate(istio_response_bytes_sum{source_workload="istio-ingressgateway", reporter=~"\(reporter",destination_mesh_id="\)mesh"}[1m])) | | Istio Component-Based Version | | Visualization of Istio component build versions, showing the distribution of versions for each component and their deployment in different clusters. This is useful for understanding the health and consistency of Istio deployments. | sum(istio_build{mesh_id="\(mesh"}) by (component, tag, mesh_cluster) | | Sidecar Resource Usage | Memory | Displays the changes in the total working set bytes per minute of the sidecar container "istio-proxy," used to monitor the memory usage of Istio proxy containers. | sum(container_memory_working_set_bytes{container="istio-proxy"}) | | | vCPU | Displays statistics of virtual CPU (vCPU) usage by the sidecar proxy, showing the rate sum of CPU usage in seconds for the container "istio-proxy." | sum(rate(container_cpu_usage_seconds_total{container="istio-proxy"}[1m])) | | | Disk | Displays statistics of disk usage by the sidecar proxy, showing the sum of file system usage bytes for the container "istio-proxy." | sum(container_fs_usage_bytes{container="istio-proxy"}) | | Istiod Resource Usage | Memory | Displays the memory usage of the Istiod service, providing a comprehensive view: - Total: The total memory usage of the Istiod service in Kubernetes. - Container Memory: The memory usage of each container in the Istiod service in Kubernetes, including different types of memory usage such as virtual memory, resident memory, heap memory, and stack memory. | Total (k8s): "sum(container_memory_working_set_bytes{container=~\"discovery\|istio-proxy\", pod=~\"istiod-.*\"})" Container ({{ container }}) (k8s): "container_memory_working_set_bytes{container=~\"discovery\|istio-proxy\", pod=~\"istiod-.*\"}" | | | vCPU | Displays the virtual CPU (vCPU) usage of the Istiod service, providing a comprehensive view: - Total: Displays the overall CPU usage of the Istiod service in Kubernetes. - Container CPU Usage: Displays the CPU usage of each container in the Istiod service in Kubernetes. - Pilot: Displays the CPU usage of the pilot component in Istiod. | Total (k8s): "sum(rate(container_cpu_usage_seconds_total{container=~\"discovery\|istio-proxy\", pod=~\"istiod-.*\"}[1m]))" Container ({{ container }}) (k8s): "sum(rate(container_cpu_usage_seconds_total{container=~\"discovery\|istio-proxy\", pod=~\"istiod-.*\"}[1m])) by (container)" Pilot: "irate(process_cpu_seconds_total{app="istiod"}[1m])" | | | Disk | Displays the disk usage of Istio components in each cluster, particularly the file system usage related to the discovery and istio-proxy containers. | sum(process_open_fds{mesh_id="\)mesh",app="istiod"}) by (mesh_cluster) container_fs_usage_bytes{ container=~"discovery|istio-proxy", pod=~"istiod-.*"} | | | Goroutines | Displays the trend of the number of Go routines in each cluster for Istio components. | sum(go_goroutines{mesh_id="$mesh", app="istiod"}) by (mesh_cluster) |
Service Monitor
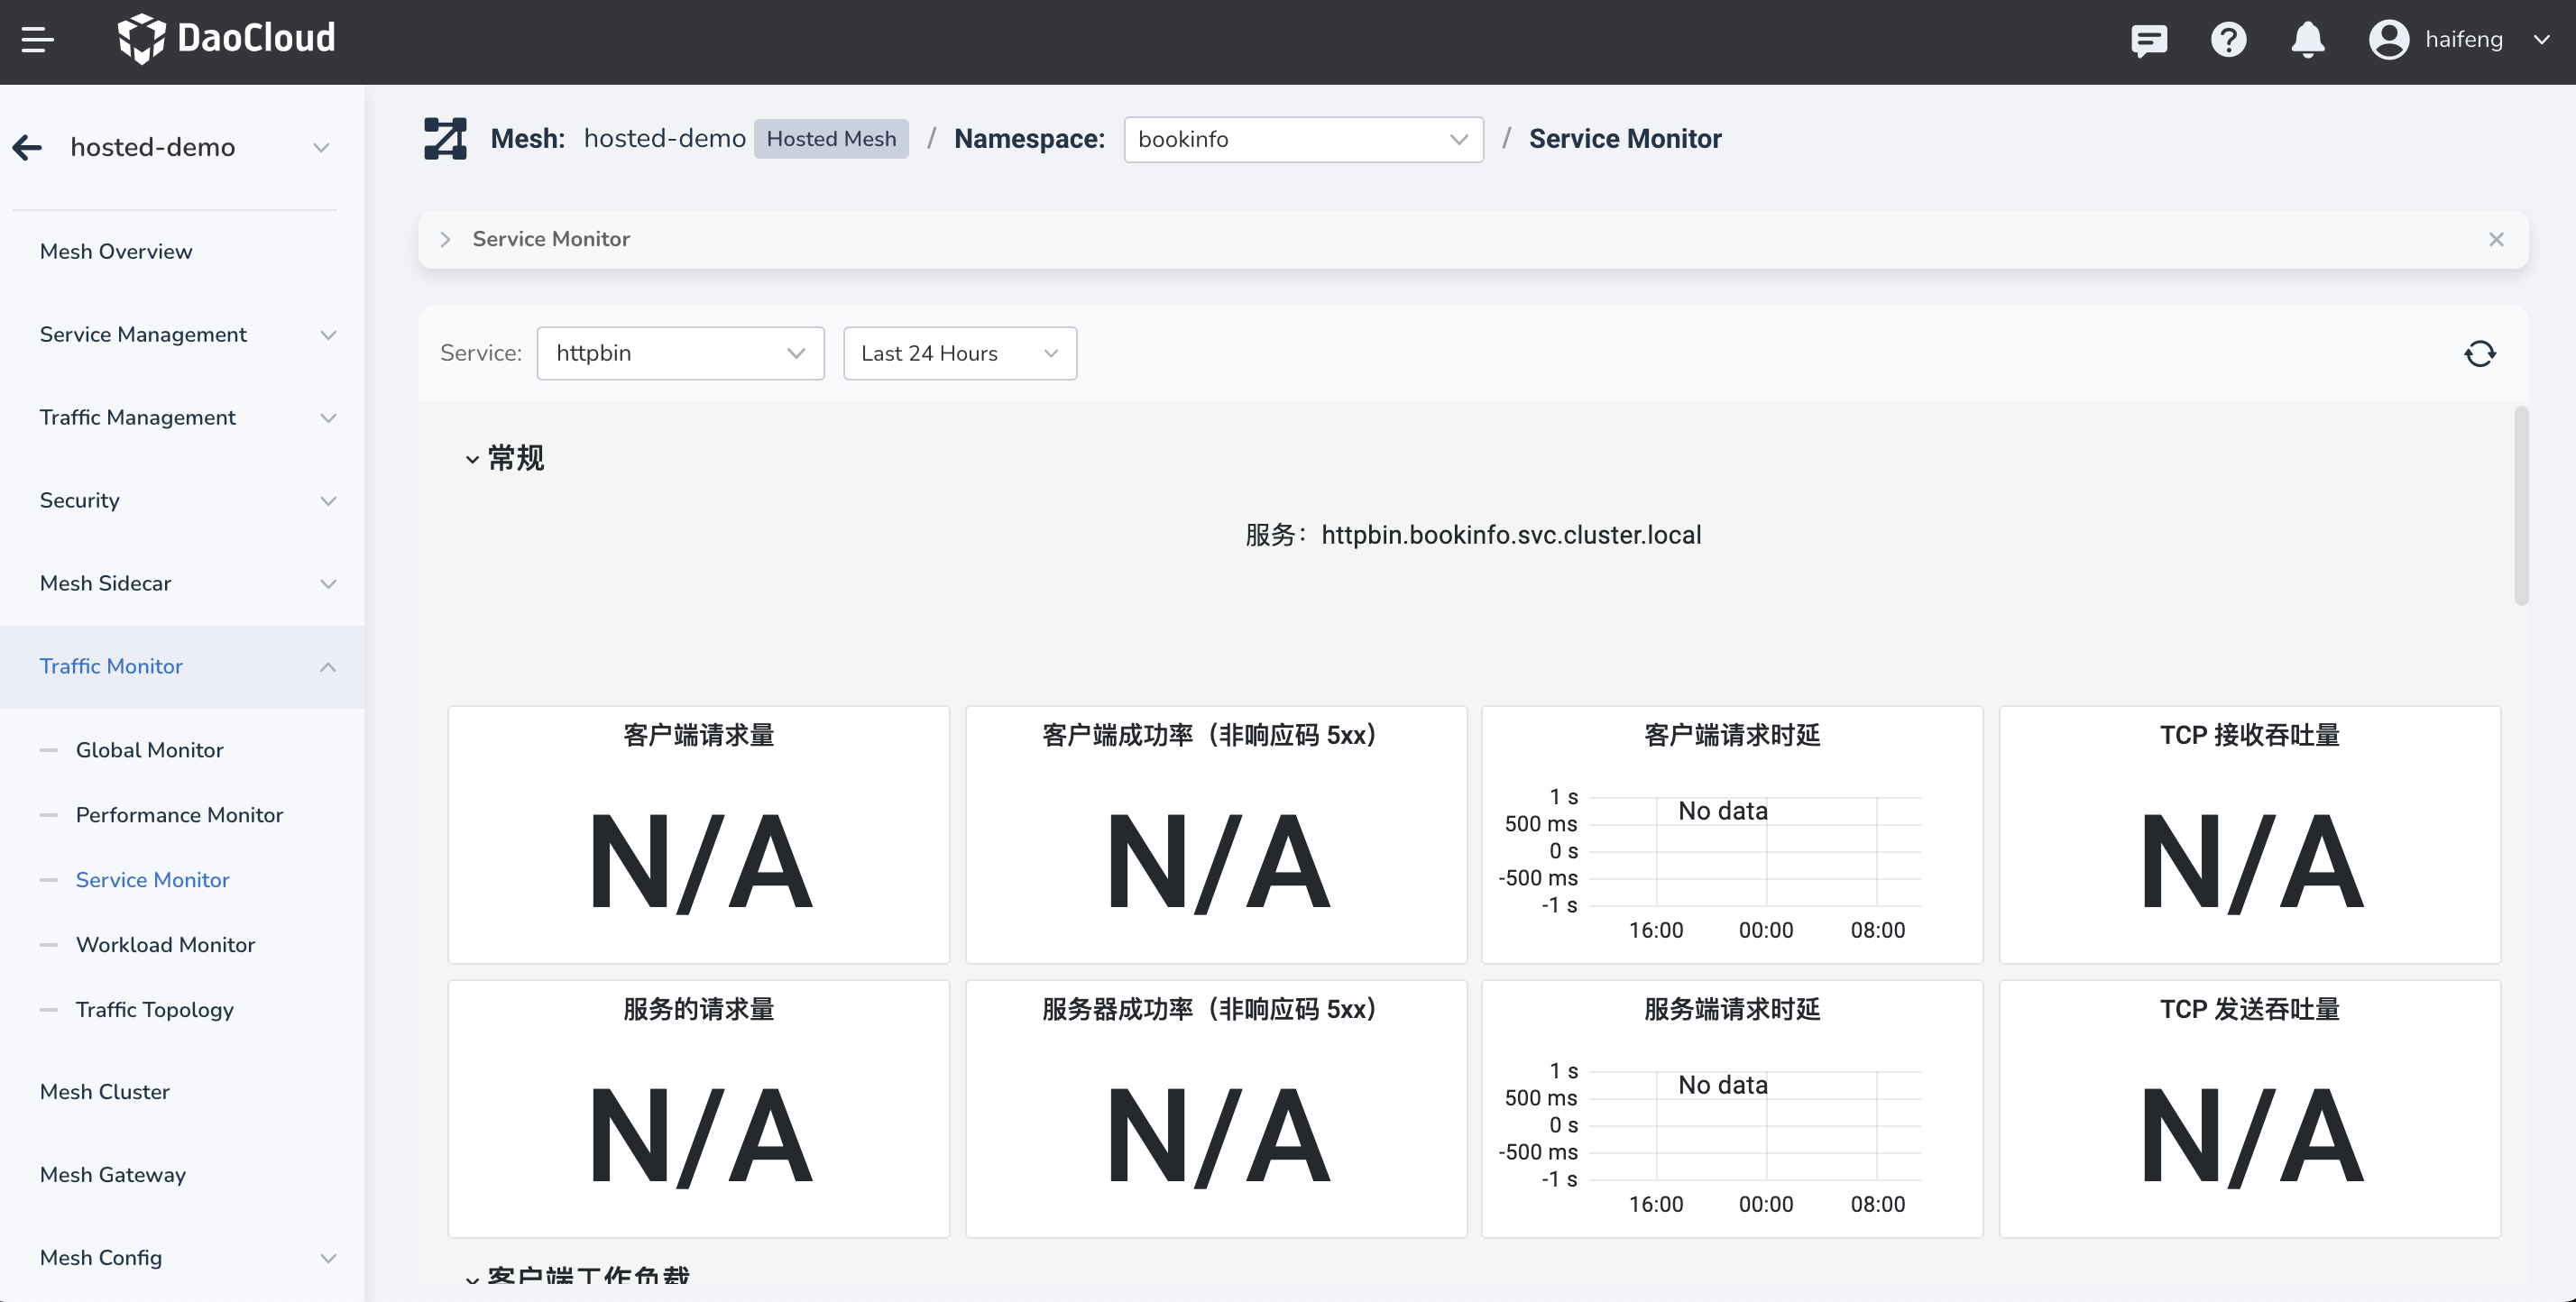
| Category | Parameters | Description | How to calculate |
|---|---|---|---|
| General | Client Request Volume | Displays the number of client requests for the current service every 5 minutes. If the result is empty, it is displayed as N/A. When the threshold exceeds 80%, it is displayed in red. | round(sum(irate(istio_requests_total{reporter="\(reporter",destination_mesh_id="\)mesh",destination_service="$service"}[5m])), 0.001) |
| Client Success Rate (non-5xx responses) | Displays the success rate of client requests for the current service every 5 minutes. It provides a visual way to quickly identify potential issues or trends. | sum(irate(istio_requests_total{reporter="\(reporter",destination_mesh_id="\)mesh",destination_service="\(service",response_code!~"5.*"}[5m])) / sum(irate(istio_requests_total{reporter=~"\)reporter",destination_mesh_id="\(mesh",destination_service=~"\)service"}[5m])) | |
| Client Request Duration | Displays the request duration for client requests of the current service. Three targets are defined to calculate the durations of P50, P90, and P99. The expressions calculate the 50th, 90th, and 99th percentiles of duration. | Example: (histogram_quantile(0.50, sum(irate(istio_request_duration_milliseconds_bucket{reporter=\"\(reporter\",destination_mesh_id=\"\)mesh\",destination_service=\"\(service\"}[1m])) by (le)) / 1000) or histogram_quantile(0.50, sum(irate(istio_request_duration_seconds_bucket{reporter=~\"\)reporter\",destination_mesh_id=\"\(mesh\",destination_service=~\"\)service\"}[1m])) by (le)) | |
| TCP Received Bytes | Displays the instantaneous rate of TCP received bytes for the current service within 1 minute. If "null" is matched, the result text is "N/A". Unit: Bps | "sum(irate(istio_tcp_received_bytes_total{reporter=~\"\(reporter\",destination_mesh_id=\"\)mesh\", destination_service=~\"$service\"}[1m]))" | |
| Server Request Volume | Displays the request volume for the current service and shows the trend over time. If "null" is matched, the result text is "N/A". Unit: Ops | round(sum(irate(istio_requests_total{reporter="destination", destination_mesh_id="\(mesh",destination_service=~"\)service"}[5m])), 0.001) | |
| Server Success Rate (non-5xx responses) | Displays the success rate of non-5xx responses for the current service. The threshold settings mark success rates below 95% as red, below 99% as orange, and 100% as green (percentage with 2 decimal places). | sum(irate(istio_requests_total{reporter="destination", destination_mesh_id="\(mesh",destination_service=~"\)service",response_code!~"5.*"}[5m])) / sum(irate(istio_requests_total{reporter="destination", destination_mesh_id="\(mesh", destination_mesh_id="\)mesh",destination_service=~"$service"}[5m])) | |
| Server Request Duration | Displays the request duration for server requests of the current service. It provides an in-depth understanding of service performance by calculating durations at different percentiles. The three target expressions calculate the median, 90th, and 99th percentile request durations to provide a performance overview from median to high-end. | - histogram_quantile - istio_request_duration_milliseconds_bucket - istio_request_duration_seconds_bucket | |
| TCP Sent Bytes | Displays the instantaneous rate of TCP sent bytes for the current service within 1 minute. If "null" is matched, the result text is "N/A". Unit: Bps | ||
| Client Workload | Incoming Requests By Source And Response Code | Displays incoming requests classified by source workload and response code, visualizing the interaction between various workloads. It calculates the connections with and without mutual TLS separately to provide insight into connection security. You can clearly understand how requests are distributed between different sources and destinations. | |
| Incoming Success Rate (non-5xx responses) By Source | Displays the incoming success rate classified by source workload and namespace, where the success rate is the percentage of non-5xx responses. It calculates the connections with and without mutual TLS separately to provide a view of the connection success rate. | sum(irate(istio_requests_total{reporter=~"\(reporter",destination_mesh_id="\)mesh", connection_security_policy="mutual_tls", destination_service=~"\(service",response_code!~"5.*", source_workload=~"\)srcwl", source_workload_namespace=~"\(srcns"}[5m])) by (source_workload, source_workload_namespace) / sum(irate(istio_requests_total{reporter=~"\)reporter",destination_mesh_id="\(mesh", connection_security_policy="mutual_tls", destination_service=~"\)service", source_workload=~"\(srcwl", source_workload_namespace=~"\)srcns"}[5m])) by (source_workload, source_workload_namespace) | |
| Incoming Request Duration By Source | Displays the request duration classified by source workload and namespace. It separately calculates different percentiles of request duration, such as P50, P90, P95, and P99. Note that the percentile values are divided by 1000 to convert the unit to seconds. | Example: (histogram_quantile(0.50, sum(irate(istio_request_duration_milliseconds_bucket{reporter=~"\(reporter",destination_mesh_id="\)mesh", connection_security_policy="mutual_tls", destination_service=~"\(service", source_workload=~"\)srcwl", source_workload_namespace=~"\(srcns"}[1m])) by (source_workload, source_workload_namespace, le)) / 1000) or histogram_quantile(0.50, sum(irate(istio_request_duration_seconds_bucket{reporter=~"\)reporter",destination_mesh_id="\(mesh", connection_security_policy="mutual_tls", destination_service=~"\)service", source_workload=~"\(srcwl", source_workload_namespace=~"\)srcns"}[1m])) by (source_workload, source_workload_namespace, le)) | |
| Incoming Request Size By Source | Displays the request size of incoming requests classified by source workload. It separately calculates different percentiles of request size, such as P50, P90, P95, and P99. | ||
| Response Size By Source | Displays the response size for the source workload at the P50, P90, P95, and P99 percentiles (🔐mTLS: indicates the percentiles of response size when mutual TLS is enabled). | ||
| Bytes Received From Incoming TCP Connections | Displays the number of bytes received by the current service through TCP connections, and shows the bytes received from TCP connections under mutual TLS connections (marked as 🔐mTLS) and non-mutual TLS connections. | ||
| Bytes Sent To Incoming TCP Connections | Displays the number of bytes sent by the current service through TCP connections, and shows the bytes received from TCP connections under mutual TLS connections (marked as 🔐mTLS) and non-mutual TLS connections. | ||
| Service Workload | Incoming Requests By Destination And Response Code | Displays incoming requests classified by destination workload and response code, visualizing the interaction between various workloads. It calculates the connections with and without mutual TLS separately to provide insight into connection security. You can clearly understand how requests are distributed between different sources and destinations. | |
| Incoming Success Rate (non-5xx responses) By Destination | Displays the incoming success rate classified by destination workload and namespace, where the success rate is the percentage of non-5xx responses. It calculates the connections with and without mutual TLS separately to provide a view of the connection success rate. | ||
| Incoming Request Duration By Service Workload | Displays the request duration classified by destination workload and namespace. It separately calculates different percentiles of request duration, such as P50, P90, P95, and P99. Note that the percentile values are divided by 1000 to convert the unit to seconds. | ||
| Incoming Request Size By Service Workload | Displays the request size of incoming requests classified by destination workload. It separately calculates different percentiles of request size, such as P50, P90, P95, and P99. | ||
| Response Size By Service Workload | Displays the response size for the destination workload at the P50, P90, P95, and P99 percentiles (🔐mTLS: indicates the percentiles of response size when mutual TLS is enabled). | ||
| Bytes Received From Incoming TCP Connections | Displays the number of bytes received by the current service through TCP connections, and shows the bytes received from TCP connections under mutual TLS connections (marked as 🔐mTLS) and non-mutual TLS connections. | ||
| Bytes Sent To Incoming TCP Connections | Displays the number of bytes sent by the current service through TCP connections, and shows the bytes received from TCP connections under mutual TLS connections (marked as 🔐mTLS) and non-mutual TLS connections. |
Workload Monitor
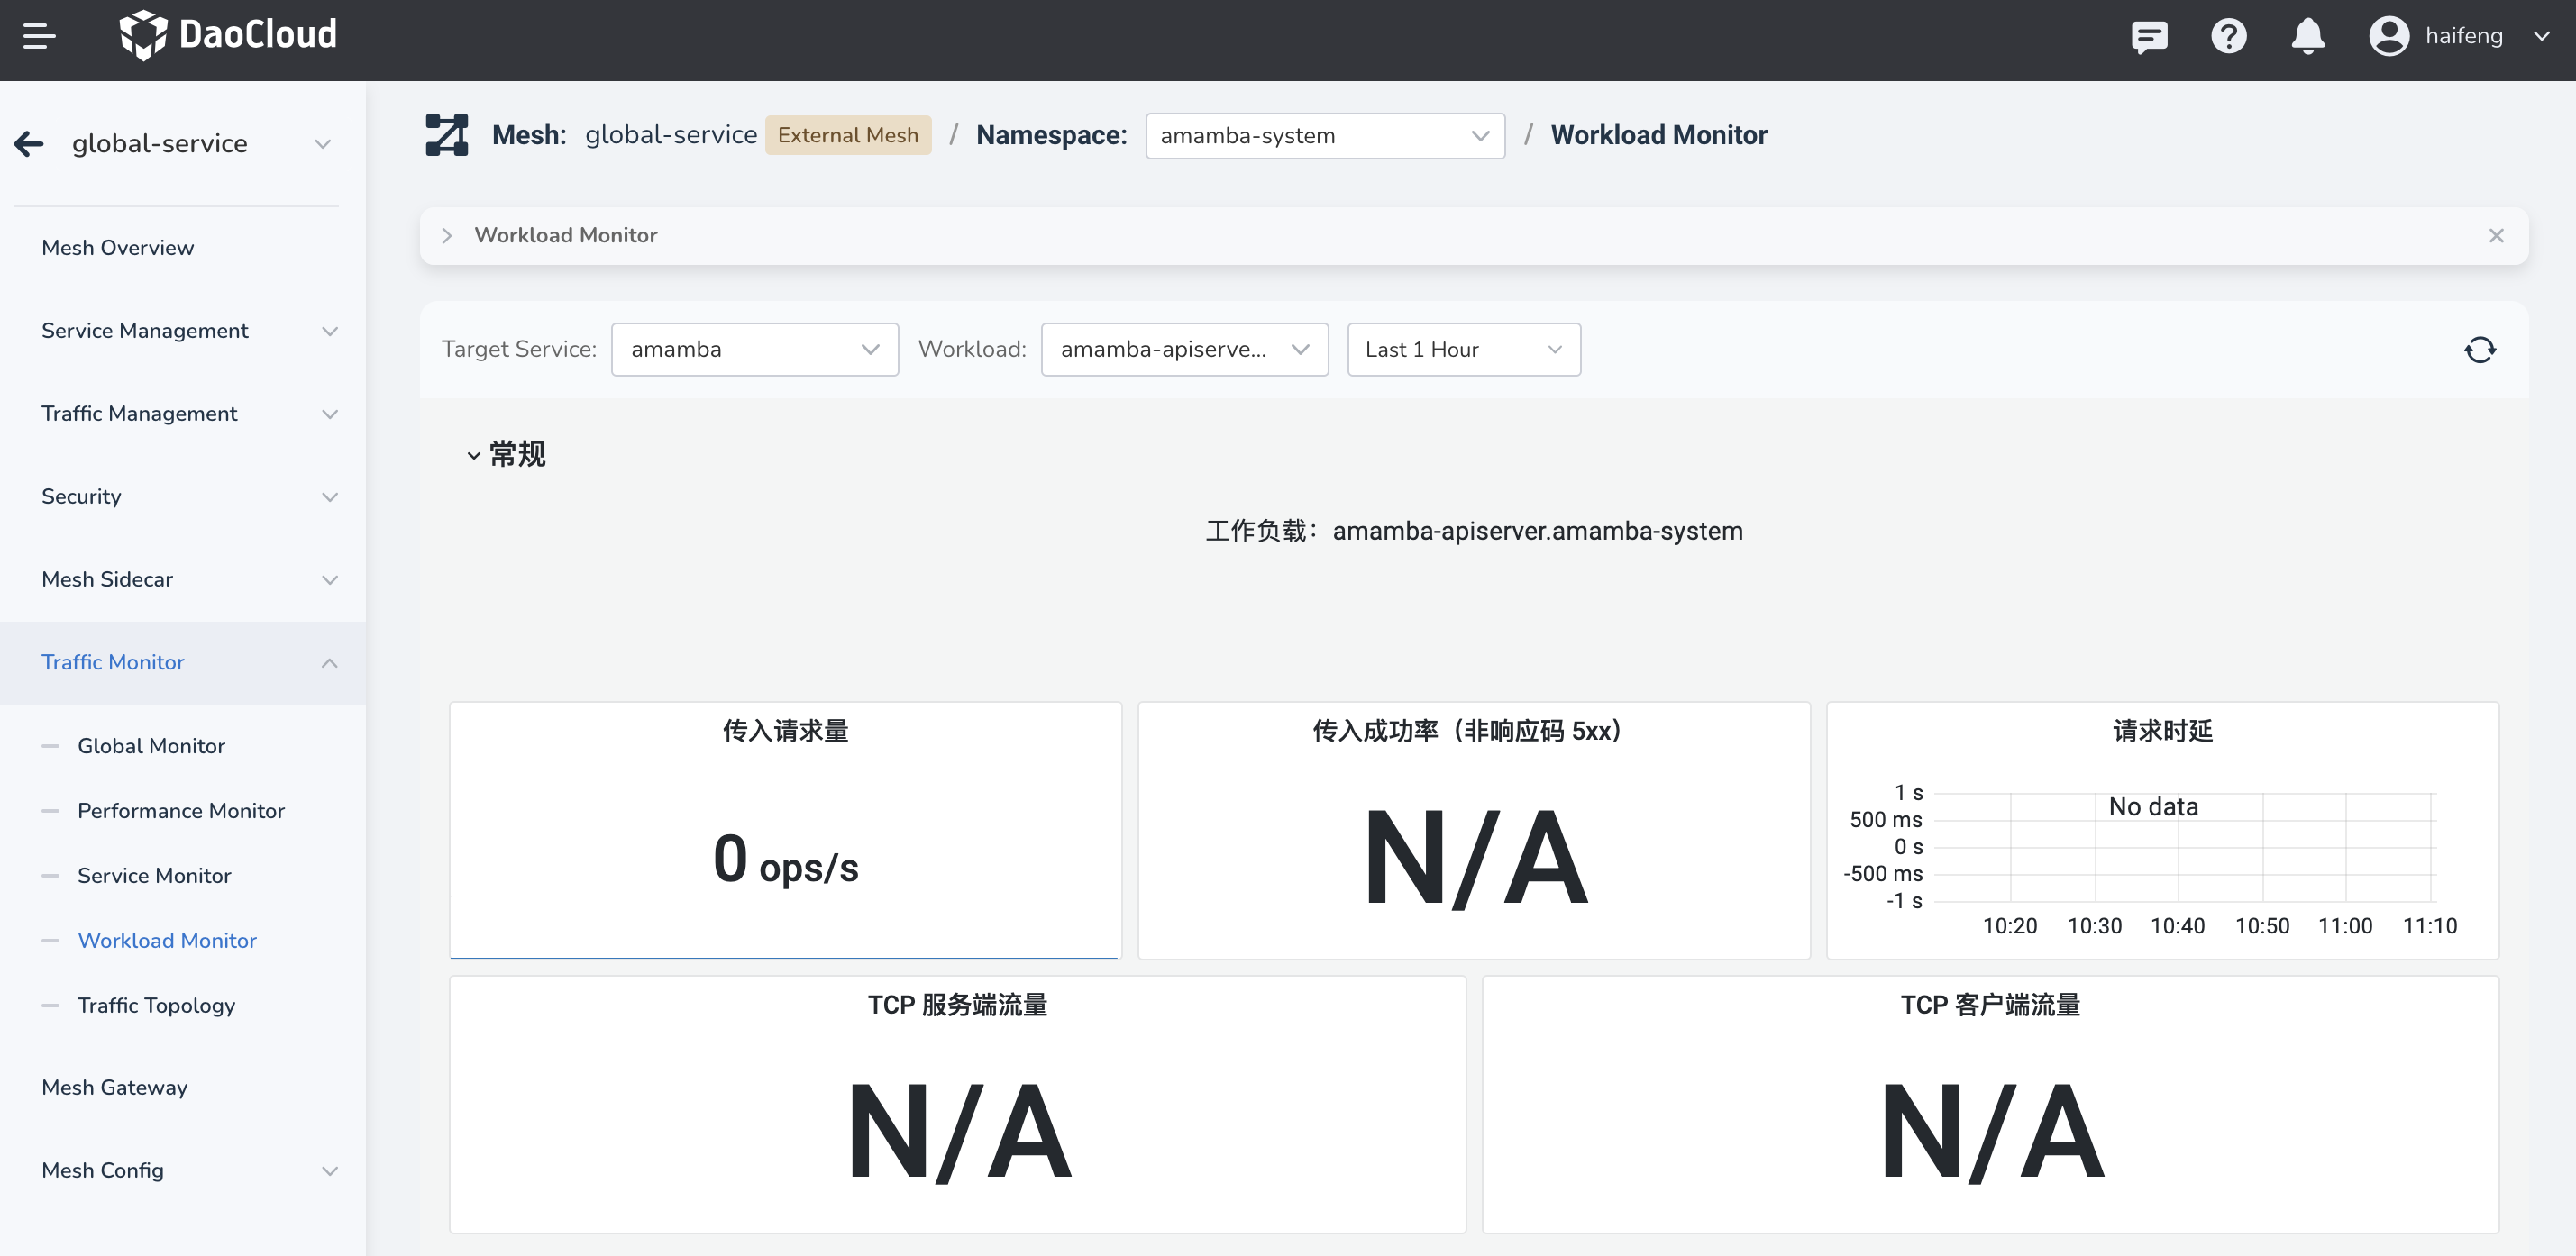
| Category | Parameters | Description | How to calculate |
|---|---|---|---|
| General | Incoming Request Volume | Displays the incoming request volume for the current workload in Ops. If the received data is empty (null), it will be displayed as "N/A". | Calculates the total number of incoming requests in the past 5 minutes, including specific destination workloads, namespaces, and clusters. |
| Incoming Success Rate (non-5xx responses) | Displays the success rate of incoming requests (excluding 5xx responses) for the current workload every 5 minutes, providing a visual way to quickly identify potential issues or trends. If the success rate is below 95%, it will be displayed in red; if it's below 99%, it will be displayed in orange. | Uses two queries with denominators and numerators to calculate the percentage of non-5xx responses. The numerator calculates the non-5xx responses associated with a specific service, while the denominator calculates all requests associated with that service. | |
| Request Duration | Displays the request duration for the current workload, showing the request duration for P50, P90, and P99. This can be used to observe system performance and quickly identify potential bottlenecks or latency issues. | (histogram_quantile(0.50, sum(irate(istio_request_duration_milliseconds_bucket{reporter="\(reporter",destination_mesh_id="\)mesh",destination_workload="\(workload", destination_cluster=~"\)dstcluster", destination_workload_namespace=~"\(namespace"}[1m])) by (le)) / 1000) or histogram_quantile(0.50, sum(irate(istio_request_duration_seconds_bucket{reporter=~"\)reporter",destination_mesh_id="\(mesh",destination_workload=~"\)workload", destination_cluster=~"\(dstcluster", destination_workload_namespace=~"\)namespace"}[1m])) by (le)) | |
| TCP Server Traffic | Displays the TCP server traffic for the current workload, focusing on statistics as a target workload, namespace, and cluster. This helps understand network load and potential bottlenecks, showing the total number of bytes sent and received per second (Bps). | destination_workload_namespace=~"\(namespace", destination_workload=~"\)workload", destination_cluster=~"$dstcluster" | |
| TCP Client Traffic | Displays the TCP client traffic for the current workload, focusing on statistics as a source workload, namespace, and cluster. This helps understand network load and potential bottlenecks, showing the total number of bytes sent and received per second (Bps). | source_workload_namespace=~"\(namespace", source_workload=~"\)workload" | |
| Inbound Workload | Incoming Requests By Source And Response Code | Displays incoming requests classified based on the source workload and response code for the current workload. It calculates the incoming request rate with and without mutual TLS connections, and categorizes them by source workload, source namespace, and response code. | Example: round(sum(irate(istio_requests_total{connection_security_policy!="mutual_tls", destination_workload_namespace=~"\(namespace", destination_workload=~"\)workload", destination_cluster=~"\(dstcluster", reporter=~"\)reporter",destination_mesh_id="\(mesh", source_workload=~"\)srcwl", source_workload_namespace=~"$srcns"}[5m])) by (source_workload, source_workload_namespace, response_code), 0.001) |
| Incoming Success Rate (non-5xx responses) By Source | Displays the ratio of successful incoming requests (non-5xx responses), classified by whether mutual TLS is used or not, and further grouped by source workload and source namespace. | sum(irate(istio_requests_total{reporter=~"\(reporter",destination_mesh_id="\)mesh", connection_security_policy="mutual_tls", destination_workload_namespace=~"\(namespace", destination_workload=~"\)workload", destination_cluster=~"\(dstcluster",response_code!~"5.*", source_workload=~"\)srcwl", source_workload_namespace=~"\(srcns"}[5m])) by (source_workload, source_workload_namespace) / sum(irate(istio_requests_total{reporter=~"\)reporter",destination_mesh_id="\(mesh", connection_security_policy="mutual_tls", destination_workload_namespace=~"\)namespace", destination_workload=~"\(workload", destination_cluster=~"\)dstcluster", source_workload=~"\(srcwl", source_workload_namespace=~"\)srcns"}[5m])) by (source_workload, source_workload_namespace) | |
| Request Duration By Source | Displays the request duration of the source workload with mutual TLS (marked as 🔐mTLS) and without mutual TLS. Through various percentiles such as P50, P90, and P99, the performance of different workloads can be better understood. | ||
| Incoming Request Size By Source | Displays a chart of the request sizes from different sources, with the request sizes for different percentiles such as P50, P90, P95, and P99 added for calculation. | ||
| Response Size By Source | Displays a line chart of the response size, which can be used to monitor the response size from different sources. It uses the histogram_quantile function to calculate the response byte size at different percentiles (such as P50, P90, P95, and P99). | ||
| Bytes Received From Incoming TCP Connections | Displays the byte reception related to incoming TCP connections, indicating the data related to mTLS and non-mTLS connections separately. | ||
| Bytes Sent To Incoming TCP Connections | Displays a visual representation of the bytes sent to incoming TCP connections. Combined with the previous charts, it provides a complete monitoring view of TCP connections, while comparing connections with and without mTLS enabled. | ||
| Outbound Workload | Outgoing Requests By Destination And Response Code | Displays outgoing requests by destination and response code for the current workload, based on the istio_requests_total metric, showing the request volume with and without mTLS. | round(sum(irate(istio_requests_total{destination_principal=~"spiffe.*", source_workload_namespace=~"\(namespace", source_workload=~"\)workload", reporter="source", destination_mesh_id="\(mesh", destination_service=~"\)dstsvc"}[5m])) by (destination_service, response_code), 0.001) |
| Outgoing Success Rate (non-5xx responses) By Destination | Displays the ratio of successful outgoing requests (non-5xx responses), classified by whether mutual TLS is used or not, and further grouped by source workload and source namespace. | ||
| Request Duration By Destination | Displays the percentile of the request duration for outgoing requests to the destination, supporting P50, P90, P95, and P99. Both mTLS and non-mTLS security policies are supported. Unit: s/ms. | ||
| Request Size By Destination | Displays the request size of outgoing requests with and without mTLS, supporting P50, P90, P95, and P99. The expressions filter by labels related to Istio, workload, namespace, and destination service. | ||
| Response Size By Destination | Displays the response size for different outgoing destinations, calculating the P50, P90, P95, and P99 values, some of which are associated with the mutual_tls connection security policy. | ||
| Bytes Sent To Outbound TCP Connections | Displays the bytes sent over TCP connections. By comparing mTLS (mutual TLS) and non-mTLS connections, you can gain insight into the bytes sent under different security policies. | ||
| Bytes Received From Outbound TCP Connections | Displays the bytes received through external TCP connections to the destination service, separately counting the total bytes of connections protected by mutual TLS and those not protected by mutual TLS. | Example: round(sum(irate(istio_tcp_sent_bytes_total{reporter="source", destination_mesh_id="\(mesh", connection_security_policy!="mutual_tls", source_workload_namespace=~"\)namespace", source_workload=~"\(workload", destination_service=~"\)dstsvc"}[1m])) by (destination_service), 0.001) |